Great job with the S&P500. After I keep saying to follow the uptrend since January, I said in April to wait for a pause of the uptrend, here it is!
Read the article
Thursday, May 9, 2019

Thursday, May 2, 2019
Live Cattle prices falling down... and the S&P500
Strong fall of Live Cattle prices; were we able to forecast it? The answer is yes, perfectly! What’s next? The S&P500 keeps pushing higher. Is it time for a pullback?
Here is the last post: https://iaminwallstreet.com/live-cattle-strong-fall-and-more/
Here is the last post: https://iaminwallstreet.com/live-cattle-strong-fall-and-more/
Have you missed my last posts?
You can read my last posts using this link: https://iaminwallstreet.com/blog-forecast-studies-analysis-trading-signals-astro-trading/
I have been saying to stick with the uptrend of the S&P500 since January...
I have been saying to stick with the uptrend of the S&P500 since January...
Monday, August 13, 2018
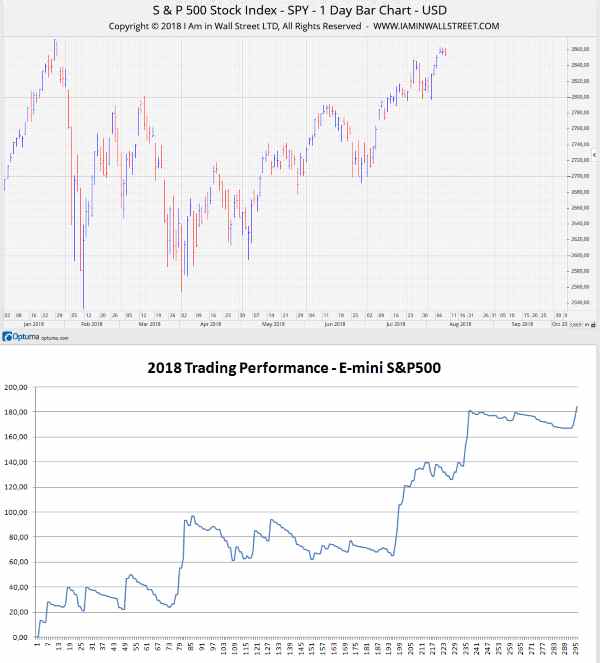
2018 Trading Performance
We are showing our trading performance since the beginning of the year. We are in profits with all the Futures Market we trade through our Daily Report Service.
READ MORE...
READ MORE...
Wednesday, April 4, 2018
2018 Cotton Forecast: April Buy Opportunity?
I
discovered the Cotton Market a few years ago, and I could see how my forecast
model worked so well with it, in the past! Here, I share with you the last
Update I sent to my Subscribers, with the opportunity to see what's next in
April and what prices we should monitor.
Tuesday, March 13, 2018
Soybeans: how I did forecast the drop from the first of March
There are many studies I use to forecast
and trade the Soybeans Market, which is one of my favoite. Let's see, here, why
we had to expect a pullback considering the work of Jeanne Long.
Read the article here...
Read the article here...
Tuesday, February 6, 2018
S&P500: how it repeats itself
The S&P500 Index saw a higher volatility in the last days, something that is scaring the Bulls. Is the uptrend pattern still alive?
The parabolic pattern of the S&P500 is in front of everyone, and usually, once the uptrend is over, we see a break of this pattern, with higher volatility. To prove what I am saying, we can look at the past, because a guy said: "the Market repeats itself". The problem is to understand how this sentence is correct.
Friday, January 26, 2018
See you, US Dollar
The US
Dollar is very weak, here we have a few important levels we should monitor with
attention, because things are not getting well for the US
currency
Wednesday, January 17, 2018
EUR/USD: something we should consider
Something very important happened to the
EUR/USD exchange, something we cannot avoid looking at, something we should all
know (if you missed it)...
https://www.iaminwallstreet.com/Articles/2018-01-17-something-important-happened-to-eurusd.html
https://www.iaminwallstreet.com/Articles/2018-01-17-something-important-happened-to-eurusd.html
Friday, January 12, 2018
Not that hard to make profits in this period
Do not tell me it is hard
to make profits in this period
I am talking about financial trading, of course. We are going to see the pattern that helps us to follow the uptrend with intelligent stops
THIS IS AN UPTREND
It is so evident, the Market is going up, and not just the S&P500, but also Crude Oil. They have a clear pattern that is easy to see, and this is the reason you must be mad opening SHORT positions right now! I am not telling you that this Market will not go down anymore, I am just saying that the chances to make profits following the uptrend are much higher than betting on a downtrend; but the time is running out to get advantage of this bargain. Let's see a few charts:


As long as this pattern does not change, there is nothing else to do but following the uptrend. Obviously, always with precise strategies.
OUR OLD FRIEND "TRAILING STOP"
In my opinion, with this pattern, we can use a very simple tool: the Trailing Stop. This is what I am doing with my customers. I use precise levels calculated with my studies, then I open LONG positions above them, and I use a stop under them; when the Market goes higher, I move my Key Level to a higher price.
We trade the S&P500, and in October 2017 I simply said to follow the uptrend above 2547 points, with a stop under it. In December I said to follow the uptrend above 2658 points with stop under it. In the last week, I moved my Key Level to 2735 Futures Points, and we are following the uptrend, again, with a stop under it (and yesterday we increased the LONG position at the support, because the S&P500 went close to 2735 points, where we knew we could trade with a very little risk...). This is a Trailing Stop! Let's all be grateful to it during these times! We are doing the same with Crude Oil.
Do I usually trade with Trailing Stops?
Honestly, I do not use Trailing Stops with my original approach; but this is the strength of being a semi-automated system trader, and not just an robot or machine! Conditions change, and we have to be wise and humble to change with the Market. I do not use Trailing Stops, usually, but this is the time to use this technique.
Now, you are wondering how do we calculate the Key Levels... well, that's our job :)
OTHER OPPORTUNITIES?
Guys, Stocks are flying! I am trading them, and I feel so safe with my system, because with single Stocks I can diversificate easily! I trade 22 Stocks, I follow the uptrend with most of them right now, and I just take some profits and let the remaining to run, using a stop-loss just below the entry point (the entry point was planned to a precise level due to our studies, of course).
We went public with our strategy, in April 20, with our free Stock Strategy Daily Report, you can see all the results, so far, on the website (updated every week):
At the moment we have a profit of +9.96% without leverage on the entire capital (this is important, on the entire capital!), always taking a very low risk. The drawdown has never been higher than 1.45%. It means we can use a 4:1 leverage with a low risk and get a perfomrance of +39.86%). How? Just following the uptrend with tight stops!
(***) - we are still working on this website, but you can sign up for free to get the Daily Report.
SUMMING UP...
If you believe in Crystal Balls, you probably think to know when the right time to SHORT is coming... but I consider myself a wise trader, and I follow the uptrend as long as it is not the Market to tell me that something has changed. I would suggest you to do the same :)
Best Regards,
Daniele Prandelli
I Am in Wall Street Ltd
e-mail: info@iaminwallstreet.com
https://www.iaminwallstreet.com
https://www.iaminwallstreet.com
High Probaility Trading Techniques - S&P500, 30 Year Treasury Futures Bonds, Crude Oil, Gold, Corn, Soybeans, Wheat, Forex, Stocks, Silver, Live Cattle and S&P/ASX200.
Trading Stocks with low risk and high return - Yes, we know how to do it.
Friday, January 5, 2018
The New 2018 Bulletins are now Available
The new 2018 Bulletins are now available, here the links:
- 2018 S&P500 Analysis and Strategy Bulletin
- 2018 Corn & Soybeans Analysis and Strategy Bulletin
- 2018 Cotton Analysis and Strategy Bulletin
- 2018 Live Cattle Analysis and Strategy
We provide also a Forecast for the 2018 about the Markets here above. I know many no-expert traders rely totally on the forecast to place their trades. This is a huge mistake! For this reason, I have decided to provide a letter where I explain What is the Bulletin and How to Use It... Tough but honest!
I hope you enjoy it!
Tuesday, November 14, 2017
Monday, October 30, 2017
Allergan PLC Stocks Breakdown, how we trade it

It is easy for everyone to understand why, in October, Allergan is losing so many points. In fact, on Monday... READ MORE
Friday, October 20, 2017
This time I was wrong!
In the last Newsletter, I said I was expecting
a down push, but I was definitely wrong, and the S&P500 went up and
up to new all the time Highs. At least, I gave an interesting level
where we had to protect the position, over 2506 IP; in this way we
closed the SHORT position with a little loss. Actually, at 2511
Futures Points we opened a LONG position, because that was the signal for higher
levels, and we made some profits (even if we closed the LONG position
quite early).

First of all, let me say there are much better
Markets to trade, because a Market with a very low volatility is not good for
traders; I do not suggest to trade the S&P500, or just open
a LONG position and follow the uptrend with a stop below the trendline that
defines the trend. If you want to SHORT the S&P500, wait for a
confirmation, a beakout. With a low volatility, there is no energy to
react at any cycle or change in trend; this is the reality and we better accept
it.
There are better Markets where we are doing
well, like Gold, Soybeans (we are LONG from 922, now at 987),
T-Bonds (we are LONG from 152, it is now at 154)... But there
are also other Markets where we are not seeing any good movement, like Corn
(which is horrible), Wheat, Crude Oil.

This situation, with Low volatility, gave me the time to move to Stocks, and I
have created a new system where I can make money with a lower risk than Futures,
and I can pick up the Stocks that have the volatility I like. The website is
under-construction, but you can already subscriber to it and get the Stocks
Strategy Daily Report for FREE (the Stocks Strategy Daily Report
will be FREE for the next months; we want you to test what we offer before you
spend money for it). The Report is very easy to be read, we just provide precise
signals with stop-loss and take-profit orders.
Friday, September 15, 2017
S&P500 Forecast & Strategy
A constant uptrend, with a low volatility; this is the S&P500 in the last months. What's next? Let's see if I am right: I am expecting to see an imminent down push, I would use a stop over 2506 Index Points, which is a possible resistance area. Any time the S&P500 is under 2506 Index Points, I will be SHORT with the ES.
I do not know how strong the down push can be, but the downtrend should go on until October.
See you in a few weeks...
Friday, July 7, 2017
Is My Work a SCAM or Not?
Is My Work a SCAM or Not?
- I am sorry for this my outburst -
I am sorry, today I feel I have to explain and defend myself, after yesterday, not for the first time, I received an email from a guy that never subscribed my services, telling me that I was offering SCAM, or something similar. This is very annoying for me, I always try to explain in a very honest way everything people ask me. I know there are many SCAMS in this field, and this situation makes people feel as I am one of them.
I am doing the best I can to show not just forecasts, but precise signals based on studies, and who has subscribed my work knows that I have precise rules that I offer in my Daily Report Service. I keep a Trading Record File since 2012 of every signal I offer, hence people could see how I trade, and trust in my work. If this is not enough, in April 2017 I started something that should erase any doubt: I share my screen with Teamviewer to my Daily and Weekly Subscribers, where they can see every day(***), in real-time, the trades I take with the Futures I do personally trade. People can see over the time if I make profits or not; you can see it as a big risk, but I do believe in my work, and I thought this was the best way to help people to understand my strategy, and show them that I do not sell SCAMS. But still, I receive emails like the one I received yesterday. I think I cannot do more than showing in real-time all my trades; what can I do more than that?
One month ago, I was promoting this new skill about my Services, the Screen Sharing (see the Screen Sharing article here), and I gave to possibility to access for one day to everyone; the Account was at 508K USD more or less. This account is now at 523K USD, after one month, which means that the only purpose of trading has been achieved so far, and these are facts that every subscriber of my service could see. What can I do more than that? Showing in real-time all my trading strategy? The Screen Sharing Service is offered subscribing the Daily or Weekly Report Service.
You probably think this is strange, but do you know that most of the times I do not suggest people to subscribe my Daily Report Service, which is the top service I offer? It is because I care of people, and after an experience of 17 years, I understand when someone is ready or not to follow my strategy. Unfortunately, I meet many people that want to trade Futures without having the right knowledge, or funds enough, or time enough to follow the trades. People do not understand this is a job, not an easy way to make extra-money. Actually, trading is an easy way to lose money if you do not do it properly.
I offer different services: Bulletins are based on the forecast, and I provide 4-6 updates per year, but I do not offer I precise constant strategy in this service (this is also why it costs 1/4 the price of the Daily Report Service). Sometimes I also meet people that want to see perfect forecasts, but they do not understand that a perfect forecast does not exist mathematically, and they keep believing in fairy tales; these people are just very lazy, they do not want to work, they want to buy a forecast and make a lot of money with it; trading is not like that, wake up! I do offer forecasts that statistically give good results, but I am aware that they cannot be always right.
A more constant study with a general strategy is released in the Weekly Report, where we update the study and the strategy every week.
To have all the precise strategies every day, I offer the Daily Report Service, where you learn how I do open and close the positions in intraday using a 5-minute chart (Weekly Report included). If you have any question, please contact me.
Trust who shows you facts. The purpose of trading is only one: PROFITS. You should trust who is able to show them, because analysis is not trading, forecasting is not trading; trading is trading, and the result of it is only one final number, you should rely on that number.
(***) The Screen Sharing Service is active every day, but obviously not when I am on holiday, because I do take holidays too, I am human and I need it; or when I do volunteering (last 10 days or August every year); or when I am travelling, not being in my office.
Thursday, July 6, 2017
2017 Bulletins - Now Half Price - See the Results so far
Review of the 2017 Bulletins in the first 6 months of the year
Half Price Now, Order Here:
S&P500
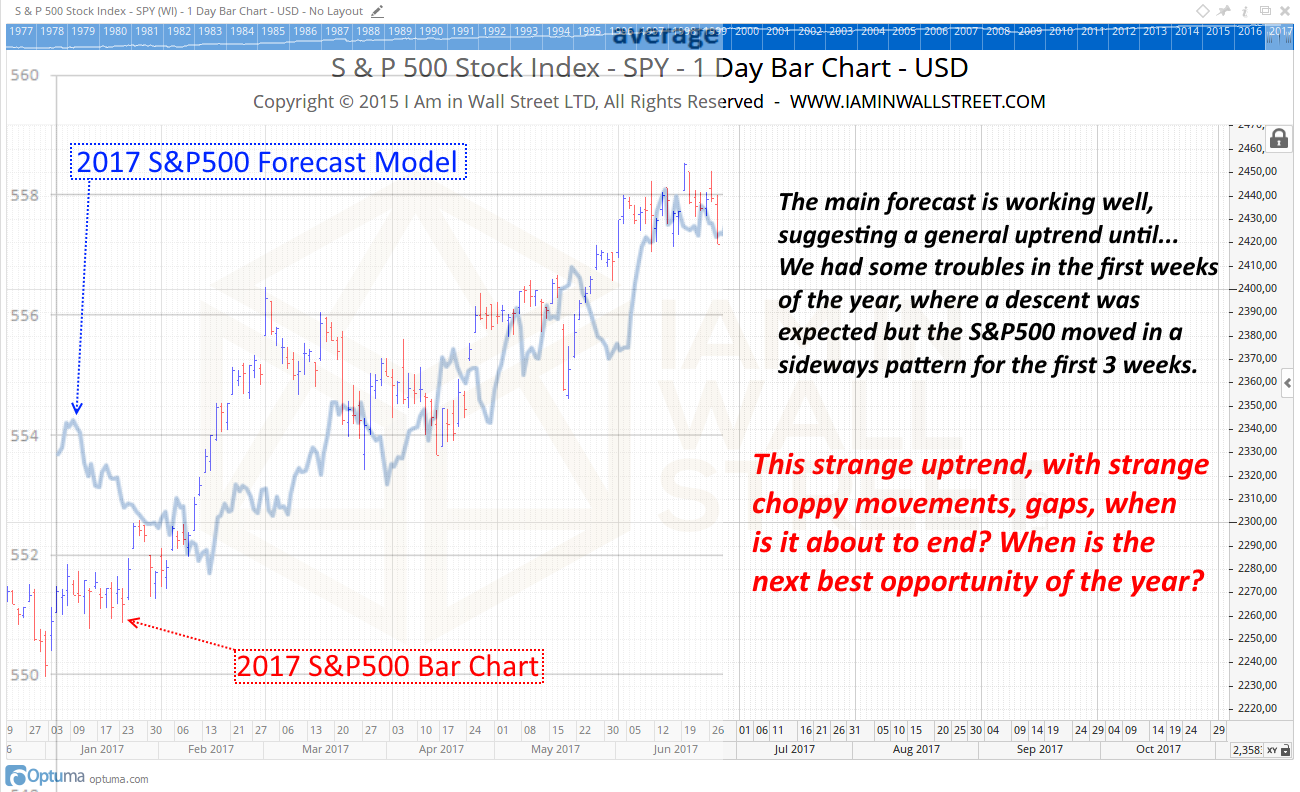
The main trend has been forecast very well.
We had some troubles at the beginning of the year where a drop was expected,
but it never happened. Also, the S&P500 is not easy to trade due to choppy
movements and narrow sideways ranges. We will write a post in the next days
about this situation. Generally, we cannot complain about the forecast,
suggesting very well the main trend. What’s next? Order now the 2017, Half Price for the last 6 months of the Year.
Cotton

The Cotton PFS did a great job until May,
even if it has missed the top of May due to unexpected news. As you can see,
the forecast also hit perfectly the top of March 2017. In the Bulletin we
managed every movement with precise levels. For example we said to use the
levels 79.54 to follow the up push above it, and take some profits, or to use
75.70 to close any LONG position under it, because under it the situation could
turn very negative. You can Order Now the 2017 Cotton Bulletin at Half Price.
Live Cattle

Great job with Live Cattle, where we could
follow a great up push at the beginning of the year. Then, we had to deal with
the up push of the end of April/beginning of May, not easy due to a high
volatility in intraday, but we used it as a new opportunity to open SHORT
positions, bringing to us new good profits. Order Now the 2017 Live Cattle Bulletin, Half Price.
Corn & Soybeans

The forecast worked very well, we cannot
complain about it, but we had to deal with a never ending sideways pattern. It
is not easy when the Market remains in such a narrow range for 8 months! But
the forecast helped us to take some profits, even if not big due to the lack of
swings.

With Soybeans we had a great forecast,
except for the period from 16 February to 31 March; our forecast model
suggested an uptrend, but the Market pushed strongly down in that period.
Obviously I had some losses, but thanks to our strategy we used intelligent
stops to protect the positions.
From April, the forecast is back to work
very well, and we believe it will continue for the rest of the year, even
because we have a great price map that is working perfectly, helping us to open
and close our positions at important Key Levels.
Tuesday, March 14, 2017
Waiting for the FOMC, the new Cotton Forecast is working...
The S&P500 is not doing any movement, not a good Market to make money, but there are other Markets we should follow; profits are profits, no matter from where they are coming...
In trading it is normal to get attached to a Market. I was in love with the S&P500, then I discovered Grians Markets, then other Commodities, and now I love all of them. Being in love with only the S&P500 is not a good thing on these days, because the low volatility is the worst enemy for a trader; we all know the volatility of the S&P500 is really horrible right now! But tomorrow the wind will change due to the FOMC Statement; also many grains markets, like Wheat and Corn, are not offering a good volatility.
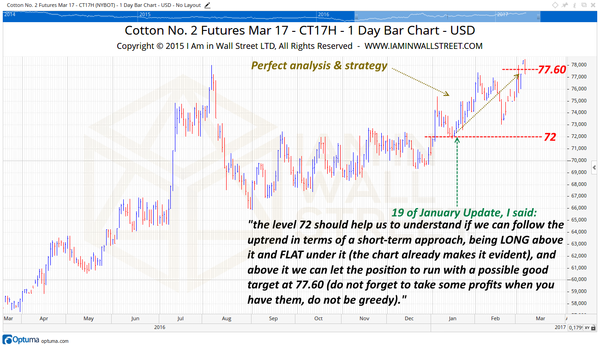
In 2017 we have introduced a new Market: Cotton. We provide a forecast model with constant updates over the year. The first update was on the 19th of January 2017, you can download it in this page:
If you read the Update you see we said to expect an uptrend, where we had to buy with stop under 72, and possible target in area 77.60. The strategy was perfect (we are not trading the March 2017 Contract anymore, the May Contract details are in the last Update).
Another good Market, but very hard to handle, is Crude Oil WTI. We said to expect a descent from this Market, and I said it 3 months ago! Unfortunately there was no point to see the end of a never ending sideways movement... until last week!
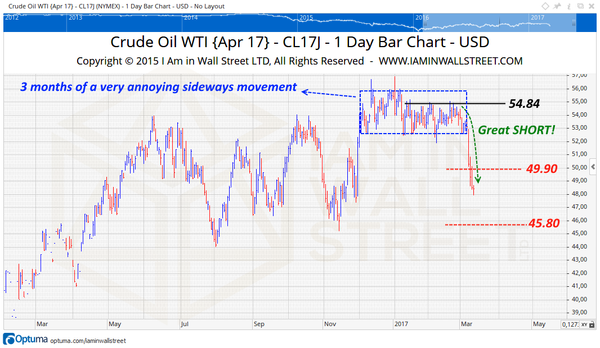
In our Reports, we said to use the April Contract with the Key Price 54.84, always SHORT under it and FLAT above it. The strategy was good, and not so hard to understand! We said to play with the Market under 54.84, opening SHORT positions at the resistance and taking some profits at lower levels, but remaining always SHORT with a part of the investment because of the expected down trend. It was a long wait, I know, but totally worth in the end! The levels in red are the possible mid-term levels where to find supports/resistances.
We deal with different Markets, and this is good when we have to manage a big portfolio. We have closed a great trade with Gold, from 1180 to 1258, but it is a lie if I tell you that in the last months we made money with every Market we trade! Grains have a low volatility, Soybeans are better than Corn and Wheat, but very choppy anyway, so, no easy to handle then. The good thing is that we keep under cotrol the losses during hard moments, and we let the profits to run with those Markets that have favorable conditions. Even the Stocks Market acted in a very strange way in the last few months (I'm talking about the US Market), we will speak about it in the next newsletter.
Contact me for any question you have: info@iaminwallstreet.com
If interested in our other studies and services, please visit the website:
You can read the previous Newsletters following this link:
Best Regards,
Daniele Prandelli
I Am in Wall Street Ltd
e-mail: info@iaminwallstreet.com
Skype: I Am in Wall Street
http://www.iaminwallstreet.com
http://www.iaminwallstreet.com
High Probaility Trading Techniques - S&P500, 30 Year Treasury Futures Bonds, Crude Oil, Gold, Corn, Soybeans, Wheat, Forex, Stocks, Silver, Live Cattle and S&P/ASX200.
Tuesday, February 28, 2017
Tradersworld Magazine - Article
Hey guys, here you can read the
TRADERSWORLD MAGAZINE
Between many articles there is also
one of them
that speaks about my work
at page 31
In the Article I show the importance of the level 20.000 points of the Dow Jones Industrial Average Index. As you can see, it was a perfect resistance and the breakout of it was a strong bull signal. Right now, we have the same important level at 2370 points of the S&P500 Index (as I said in the last week)... I am just sayig that... use it as a guide! ;)
Contact me for any question you have: info@iaminwallstreet.com
If interested in our other studies and services, please visit the website:
Monday, February 13, 2017
Subscribe the Daily Report - Special Gift for you!
SPECIAL OFFER
Included in the Daily Report,
"How to Trade to Make Profits" - E-Book!
A book that shows 1000 trades
I made in 3 months,
turning 40,000 USD in 64,000 USD,
with a performance of +58%!
In the e-book I explain how I open and close the trades that allowed me to get this performance, made with real money trading Futures.
INTERESTED IN OUR 2017 FORECASTS? NOW YOU CAN DOWNLOAD THE ORIGINAL 2016 BULLETINS AND UPDATES
2016 S&P500 FORECAST BULLETIN:
2016 CORN & SOYBEANS FORECAST BULLETIN:
You can find our services here: Service page:
Daily Report Service - The premium service
Weekly Report Service - Reports and studies every week.
Subscribe to:
Posts (Atom)